The State of Clutter
What convenience really costs
The latest analysis of market and consumer behaviors impacting digital data and privacy.

or scroll down to read it here
Introduction
How many companies have your email right now? How many subscriptions are quietly renewing? How many platforms would ignore you if you asked to leave?
We looked at the data from 6,979 active Yorba members across 132 countries, and the answers were worse than we thought.
The 2nd annual State of Clutter report shows the true cost of convenience, and what more online accounts really mean for our inboxes, bank accounts, and data privacy.
In 2002, Chinese artist Song Dong photographed over 10,000 items his late mother had hoarded throughout her life. The images are staggering; rooms stacked floor-to-ceiling with thermoses, buttons, soap slivers, decades of Beijing Daily newspapers.
What if you never threw anything away? What if every receipt, every plastic bag, every promotional keychain that crossed your threshold stayed forever?
Even worse, what if everything you thought was thrown out still lived in a room others could pay to enter?
Most of us would never tolerate that kind of physical accumulation or intrusion. Yet, increasingly, we're doing exactly this with our digital lives. Many people never even notice.

Purpose
The State of Clutter examines how digital convenience translates into persistent accumulation of online accounts, subscriptions, and retained personal data. Using anonymized, real-world behavioral data, the report documents a look into the scale of digital exposure, the friction embedded in disengagement, and the growing gap between consumer rights in theory and practice.
This report is intended to support prevention, accountability, and governance. The findings are offered to inform policymakers, researchers, journalists, and industry leaders working to address the structural conditions that allow digital clutter, silent data retention, and forced dependency to accumulate by default.
What’s new in 2025
Large-scale data collection on the web is no longer emerging. It has become a normalized practice.
A 2025 review of the 100 most-downloaded free apps in the U.S. found that approximately 75% collect data specifically to track users across apps and websites for advertising purposes.
Industry guidance in 2025 emphasized biometric authentication, AI-driven identity verification, and automated data extraction from devices or identification documents for personal data capture at the point of signup.
U.S. consumers began receiving payouts in 2025 from a long-running class-action settlement related to Facebook’s data collection practices. The settlement spans more than a decade of user activity, reiterating the persistence and scale of commercial data collection across major platforms.

AI’s rise raises new concerns
Rapid adoption of artificial intelligence and large language models used by consumers and corporations is creating new challenges for digital clutter and consumer data privacy.

In 2025, OpenAI broke into the top 10 most common subscriptions among Yorba members tracking recurring payments, positioned among legacy tools and services.

51%
An estimated 51% of spam emails are now generated by AI as new tools allow companies to pump out more messages than people can meaningfully process.
OpenAI and xAI both faced scrutiny in 2025 after user conversations from ChatGPT and Grok were made publicly accessible and indexed by search engines via sharing features.
An estimated 56% of Americans use AI for work or personal use, up 10% between August 2024 and August 2025.
Nearly three-quarters of S&P 500 companies now disclose AI as a material risk, voicing concerns about AI-amplified cybersecurity threats and fragmented regulation.
Laws and regulations struggled to outpace the industry
Despite increased scrutiny, meaningful limits on data collection remain elusive. Existing frameworks continue to permit extensive data collection and downstream data exposure, even as public awareness grows.
A federal court vacated the FTC’s proposed “click-to-cancel” rule, which aimed to require online cancellations for online sign-ups. Industry groups argued the rule would cost more than $100 million to implement. The court agreed that further analysis was required, leaving existing cancellation friction in place and reinforcing business models that rely on consumer inertia rather than active consent.
The federal government’s 2025 AI executive order preempts state regulatory efforts, rolling back oversight in the name of innovation while conceding that regulation is chasing deployment.
A 2025 evaluation by the Electronic Privacy Information Center and U.S. PIRG found that none of the 19 U.S. states with comprehensive consumer privacy laws received a top effectiveness rating, with nearly half receiving failing scores.
Academic research published in 2025 suggests even well-intended privacy regulations may fail to reduce data accumulation, and can sometimes worsen consumer outcomes. The peer-reviewed study shows that limiting collection at the surface level does not necessarily unwind downstream data use or economic incentives.

Economic incentives remain intact
The persistence of these practices remains reinforced by market dynamics.
The global data monetization market is estimated at approximately $5 billion in 2025, with projections exceeding $40 billion by 2034.
As long as personal data remains a revenue source, incentives to expand collection and retention are likely to continue outpacing both consumer understanding and regulatory enforcement.
Demand for digital conveniences is set to keep growing
Consumer research continues to show that post-pandemic adoption of digital services and conveniences has created a new normal.
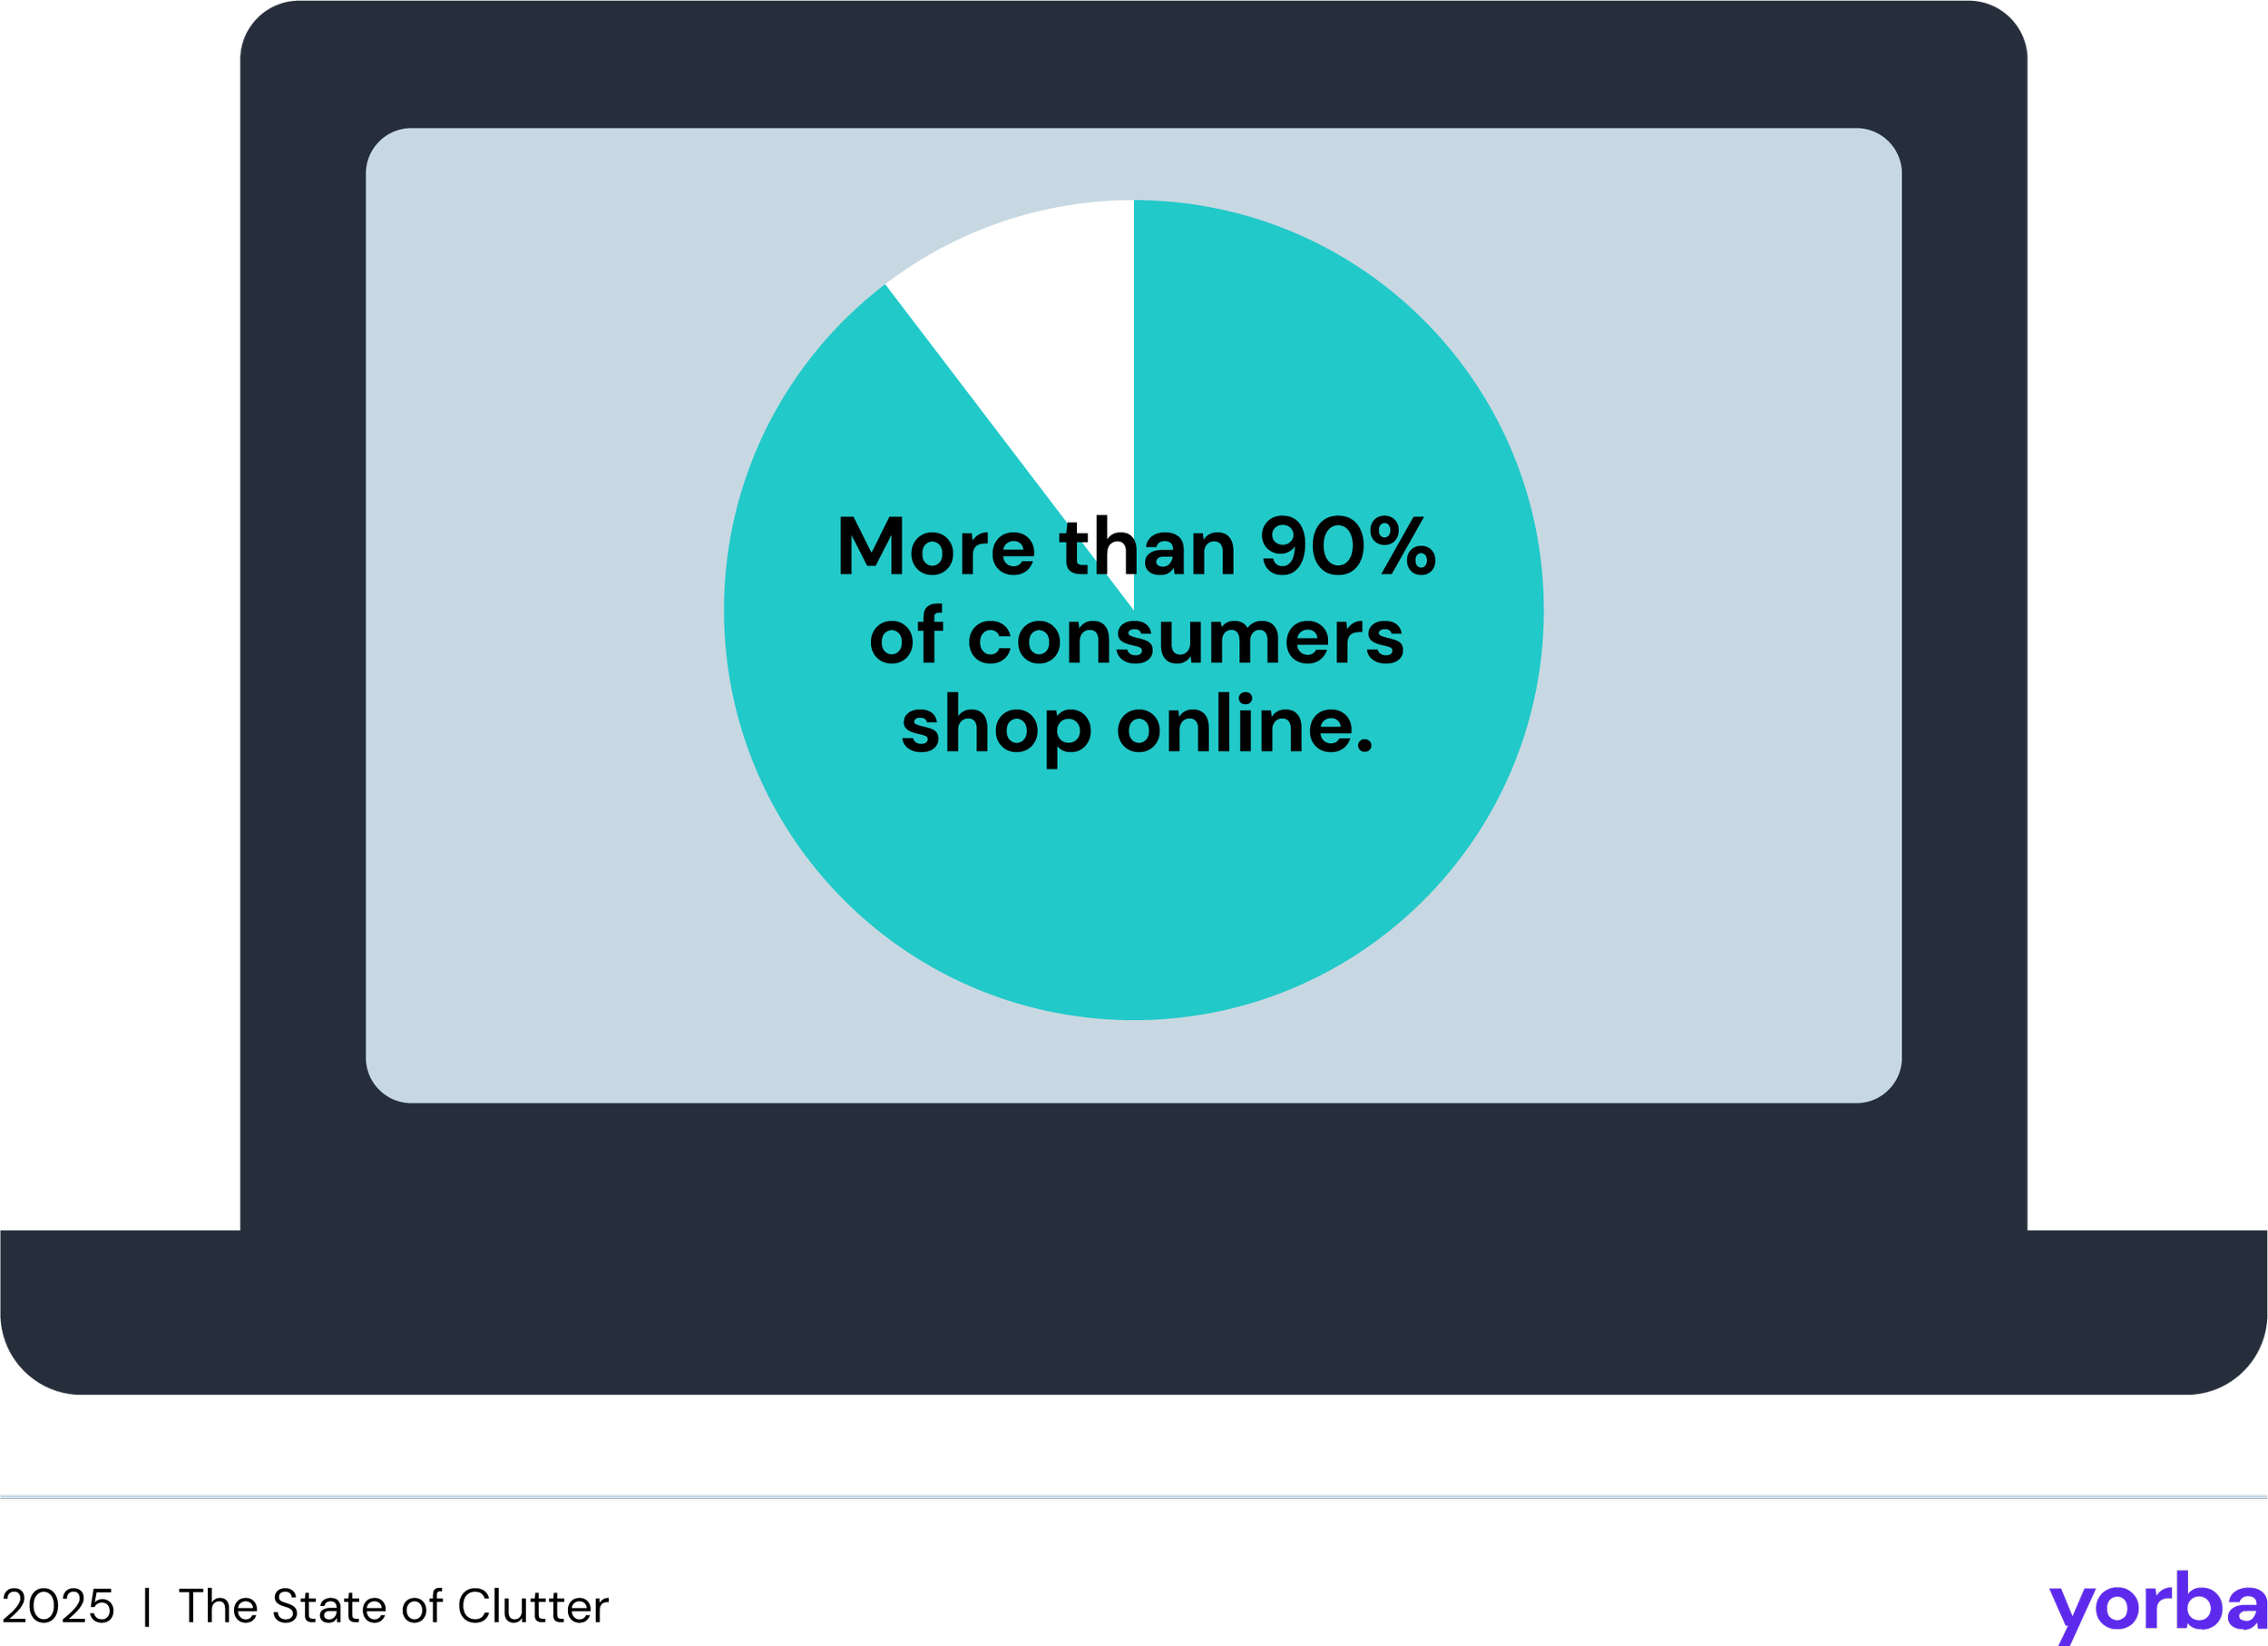
An estimated 40% of consumers now get groceries via delivery on a weekly basis. Food delivery grew from 9% to 21% of total spending in just a few years, with the online food delivery market projected to double by 2030.

Yorba’s growth in membership for 2025 indicates consumers are seeking third-party tools to manage this increased digital exposure, suggesting online accumulation remains an issue even as adoption rates plateau.
Download the full report for complete data sources, analysis methods, interpretation guidance, and known constraints.
Yorba’s Key Findings
Yorba had 6,979 active members in 2025 across 132 countries. Among new and existing members, a subset of 4,725 performed their first inbox scan in 2025 to find and manage mailing lists and online accounts.

Collective cleanup
In 2025, Yorba members collectively:
Unsubscribed from 52,361 mailing lists

Deleted 2,214 online accounts


Using sender-level send frequency at the time of unsubscribe, it is estimated that Yorba mailing list unsubscribes will prevent over 75,000 future marketing emails annually.
Digital footprint
“I was experiencing missing email, untimely response times, and intimidation by disarray.”
A Yorba member working in healthcare technology discussing motivations for seeking third-party tools for inbox management
Most common online accounts
To understand where digital exposure concentrates, we examined which online platforms were most common across Yorba members’ accounts in 2025, regardless of whether the account was actively used or later deleted.
Among Yorba members, the platforms most frequently present in 2025 include:

Most common online accounts
We examined the platforms whose marketing emails were frequently unsubscribed from in 2025 across all Yorba members.
Among Yorba members, the most frequently unsubscribed mailing lists in 2025 include:

Most deleted accounts
When it came to the most commonly deleted accounts in 2025, the platforms that had the most account deletion requests from Yorba members include:

Automated monthly spending
A subset of 420 Yorba members opted into linking financial institutions to identify recurring charges and manage ongoing subscriptions in 2025.
This cohort provided sufficient account visibility to detect recurring payments across discretionary and essential spending categories.
Recurring payment footprint
Automated and online billing is now used for an increasingly substantial share of monthly household financial activity, turning both discretionary spending and core life obligations into ongoing, often silent, digital payments.
Among Yorba members tracking subscription spending in 2025, we observed an average of 14 active recurring billing accounts per member, with a median of 11.
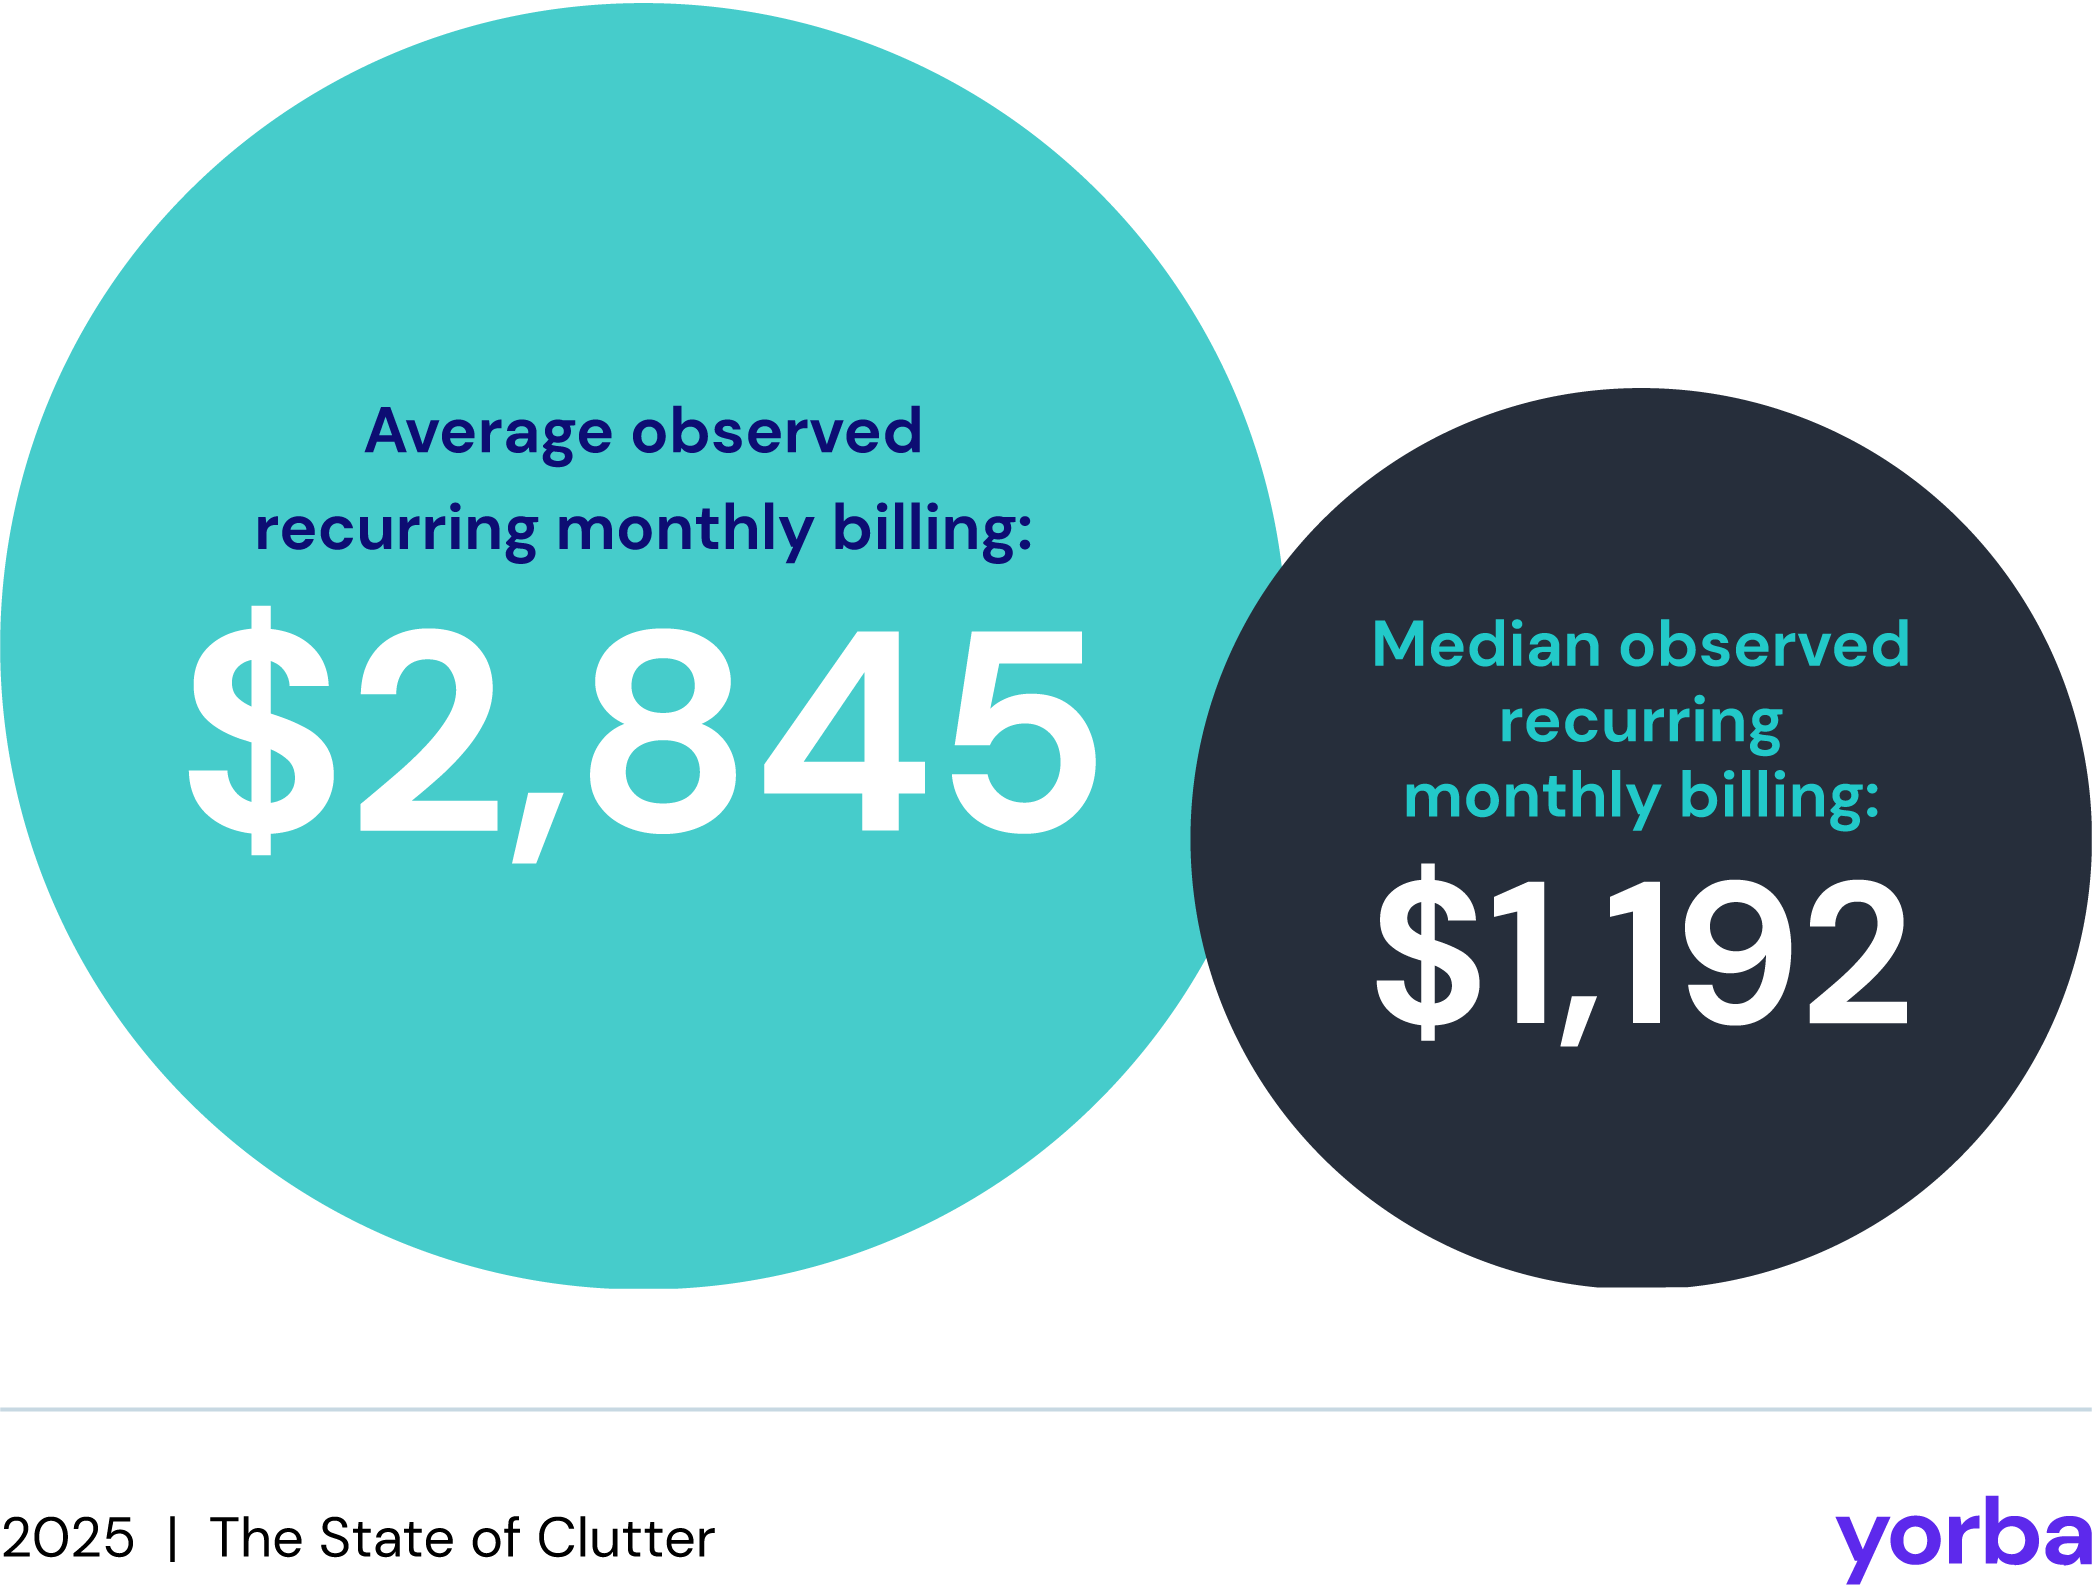
These amounts represent total detected recurring charges, which may include housing-related payments (rent or mortgage), utilities, insurance premiums, telecommunications, gym memberships, installment-based services that generate recurring charges over time, and digital services like streaming platforms, software tools, or media subscriptions.
As a result, these metrics reflect the scale of automated or recurring monthly financial commitments, not discretionary subscription spending alone.
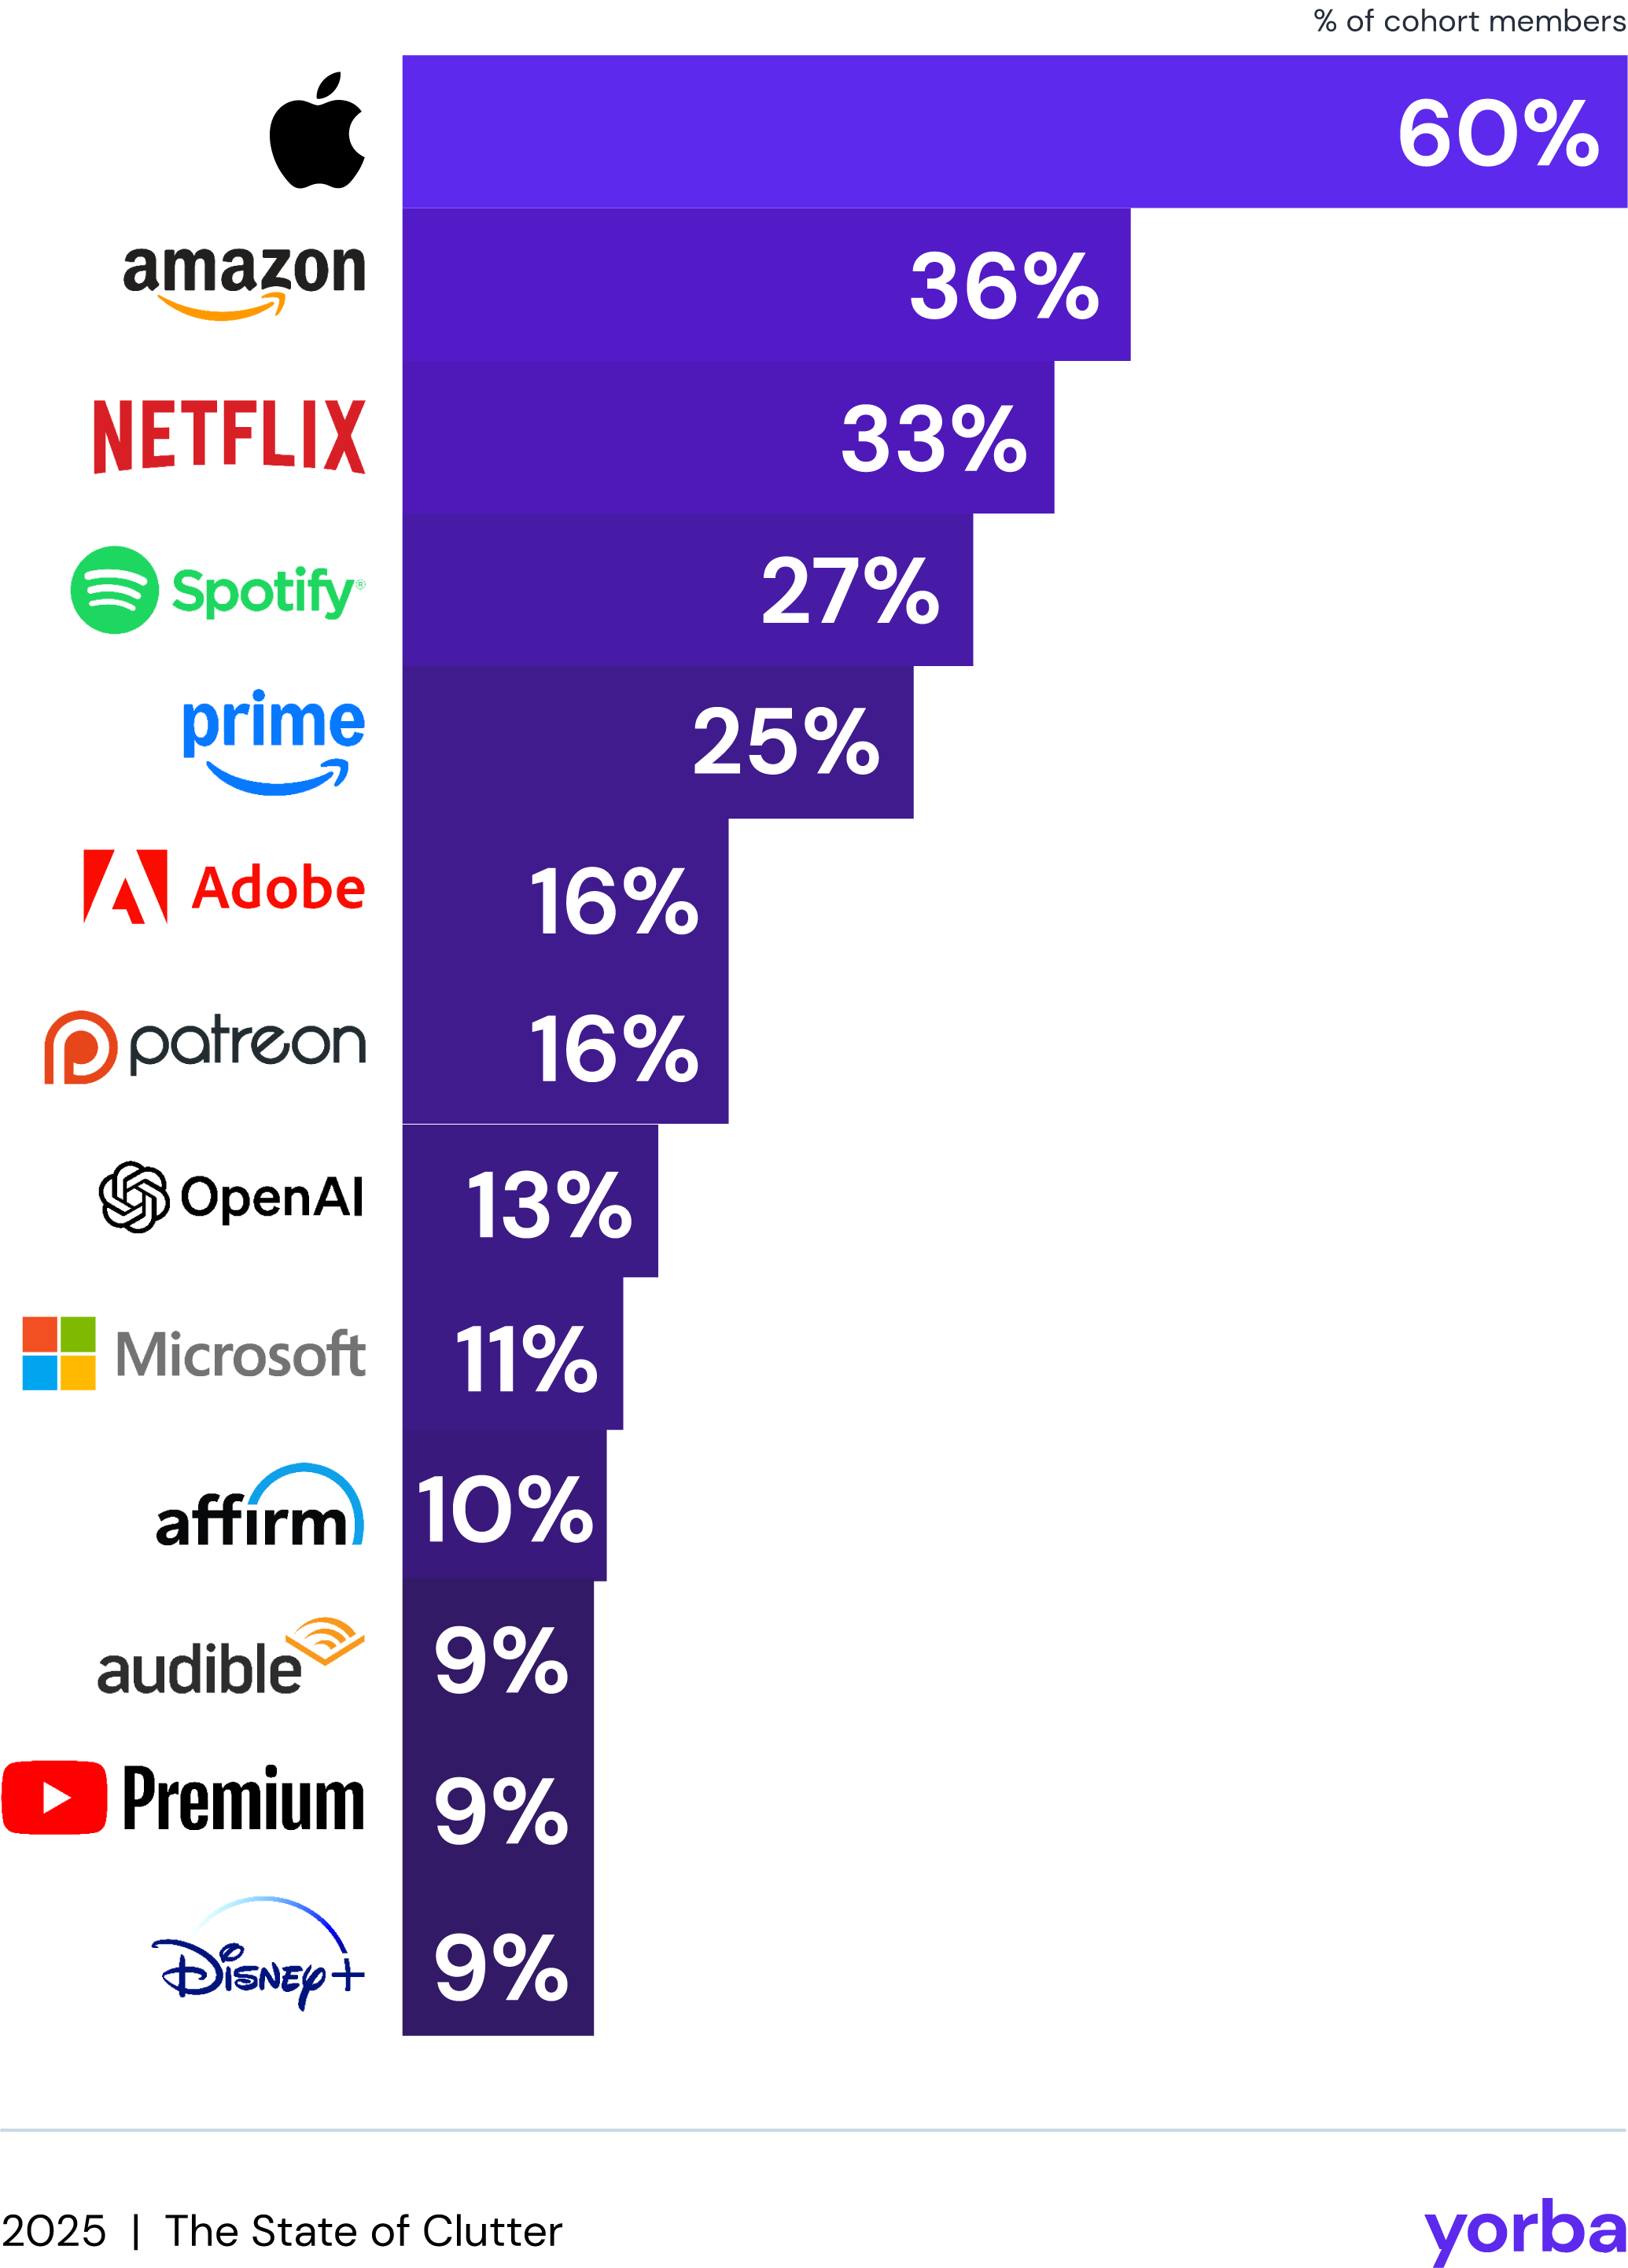
Most common subscriptions
This year, OpenAI broke into the top 10 most common paid subscriptions among Yorba members tracking recurring payments. It sits among long-established consumer and utility platforms, highlighting a rapid normalization of AI tools as recurring household or professional expenses, not just one-time or experimental purchases.
The most common paid platforms and services among Yorba member tracking recurring spending in 2025 (n=420) include:
Compliance with formal data removal requests
In 2025, Yorba introduced a dedicated deletion team. These professionals help cancel subscriptions, close accounts, and delete data on behalf of Yorba members. They act under formal legal frameworks, including Power of Attorney, and bring professional knowledge to help expedite requests.
This service was launched in response to a recurring pattern: while unsubscribing from marketing emails is typically fast and automated, full account deletion or paid subscription cancellation often requires sustained effort, repeated verification, or manual intervention.
Among 637 Yorba members who had access to the deletion team through premium membership in the second half of 2025, the deletion team:
Processed
21,925
formal deletion attempts
Submitted requests to
16,220
different companies
Logged a total of
9,996
professional labor hours on behalf of Yorba members.
Structural contrast
Yorba’s 2025 platform data reveals a stark difference between surface-level disengagement and full data exit. The contrast shows a gap between reducing noise (emails) and achieving meaningful exits (data deletion).
Email unsubscribes
We observed a 84% success rate for unsubscribe requests initiated by Yorba members for mailing lists.
These are often governed by standardized, one-click rules or mechanisms required under U.S. and EU law.
Data deletion
Around 48% of account and data removal requests submitted by members for closure or deletion by Yorba’s authorized deletion team reached confirmed deletion by the end of 2025.
These requests were often already attempted manually by members. Many require multi-step verification, repeated follow-ups, or third-party authorization that can cause requests to stall or fail entirely.
Where requests stall
Yorba’s dedicated deletion team had 10,591 unresolved requests at the time of analysis, despite proper authorization and documentation.
Common issues agents ran into included:
Travel platforms asking for repeated identity verification despite valid legal authorization.

Finance-related companies requesting documents already provided.

Platforms refusing to engage with authorized agents under any circumstances.

Hostile responses, including Power of Attorney rejection, fraud accusations, or blocked communication.

Yorba’s findings align with large-scale evidence from consumer advocacy organizations, including Consumer Reports, where Yorba participates in the Consumer Reports Data Rights Consortium focused on data rights enforcement and operational compliance.
We spoke with the team at their Permission Slip program, where Consumer Reports has submitted more than 4.5 million opt-out-of-sale and deletion requests on behalf of consumers.
“While a good number of companies are unresponsive, many others don't have solid processes for working with authorized agents. Some only respond to the user while ignoring the agent; others simply confirm receipt but do not share what actions they've taken; while a few have even seen our requests go straight to spam.”
—Houman Saberi, Operations Manager at Permission Slip (Consumer Reports Innovation Lab)
Even when formal authorization is provided and documentation is complete, deletion outcomes depend heavily on whether a company has operational maturity to handle agent-assisted requests.

The cost of friction
Some companies acknowledge and complete deletion requests within 1-3 days of submission.
These companies prove that the technical capability to process deletions efficiently exists.
Yorba modeled a standardized deletion path using cases completed within three business days, where no repeated verification or escalation occurred. We applied this baseline to all requests to understand how much professional labor is likely being consumed by inefficient and repetitive deletion processes.
These estimates reflect labor performed by trained professionals experienced in navigating formal data deletion workflows and verification requirements. For individual consumers unfamiliar with these processes, the time and effort would likely be substantially higher or lead to abandonment.